

Google Analytics Metrics You Should Be Tracking
Whether it’s an eCommerce store, a lifestyle website or online portfolio, every website has a purpose – to get your visitors to take an action that aligns with your goals.
But how do you know if your website is fulfilling its purpose?
Enter Google Analytics. While many people loathe (and maybe even fear) data analysis, Google metrics really are your best friend when it comes to optimising your website.
To help you get on board with Analytics, we’ve covered some important Google Analytics Metrics, plus how to improve them.
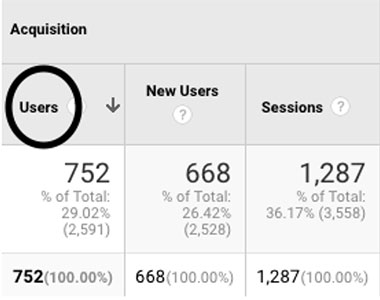
Users
Users are your visitors.
Ideally, your site would be attracting more visitors every month, as you improve SEO, optimise your advertising campaigns and earn media coverage.
If your monthly visitors are dropping, it could be a warning sign that your SEO needs serious work, that your competitors are overtaking you in organic rankings or that your ad campaigns aren’t working as well as they used to. Be sure to compare this with your search console metrics to identify your average organic position on Google search.
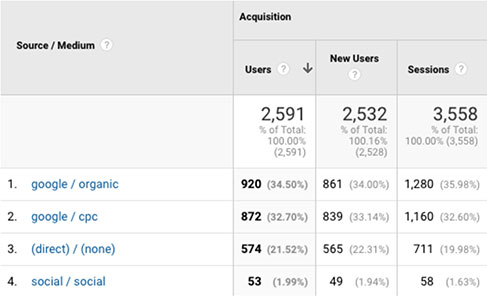
Traffic Sources
Do you know how people are finding your website?
In general, websites have 3 key sources of traffic: direct, search and referral.
Direct visitors reached your site through typing your web address directly into their browser – they are searching for you and only you.
They are likely to have visited your website before or they may have remembered your website from an ad or other source. If you don’t receive many direct visitors, your URL may be too hard to remember or not adequately advertised.
Search visitors found you through a search engine like Google. They’re looking for something online and your website seems to fit the bill.
Referral visitors are the ones who have come across your site via a link or mention on another website, blog or social media post.
Once you know where most of your traffic comes from, you can invest more resources in that channel, whether it’s search, social or referral links from other blogs. A great tool for building specific url links and identifying how your email newsletters, social posts or ads are performing is Google’s Campaign URL Builder.
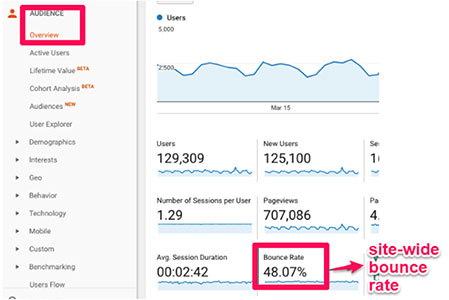
Bounce Rate
Your bounce rate is the percentage of people who visit your site and then leave without any interaction. People generally bounce when they can’t find what they are looking for, they’ve arrived at the wrong site, or a site takes too long to load.
Depending on your industry, an average bounce rate could vary between 26% and 70% for most businesses, so be sure to do some research to determine yours (RocketFuel, 2019).
High bounce rates can indicate a number of things:
- Slow load times
- Chunky content that is difficult to skim
- Content that is unrelated to their search
- Low-quality content or content that is difficult to understand
- Poor design / UX
- Poor mobile experience
Monitor your bounce rate in Google Analytics. If it’s on the high side, take a look at whether any of the above points may be impacting the user experience.
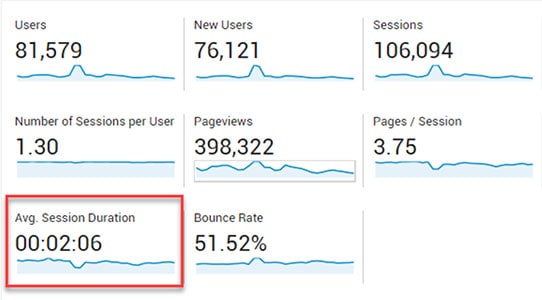
Average Session Duration
Average Session Duration is the average amount of time a user spends on your website.
If your site is packed with valuable content, your average session duration is likely to be high. This is good – your visitors are engaged. Consider creating strong, in-depth content so your visitors stick around.
However, a short session duration isn’t always a bad thing. If your site is simple, with just one desired action, like contacting you, you might have a low average session duration but a high performing site. So make sure to check your conversions too.
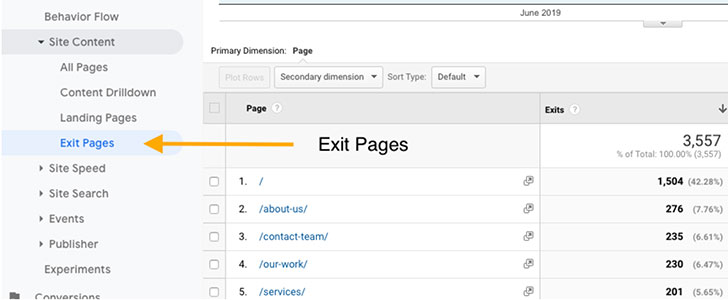
Exit Pages
An exit page is the last page a visitor was on before leaving your site.
Check your exit pages to understand where and when visitors leave your website.
If visitors are exiting from your order confirmation page – that’s great! They’ve done what they needed to do on your website.
If, however, they are leaving in the middle of the check out process or from a search page, it might be a sign that they’ve become frustrated or couldn’t find what they are looking for.
To encourage users to continue through your funnel, figure out at what point you’re losing user interest and develop or evolve your existing processes to meet their needs.
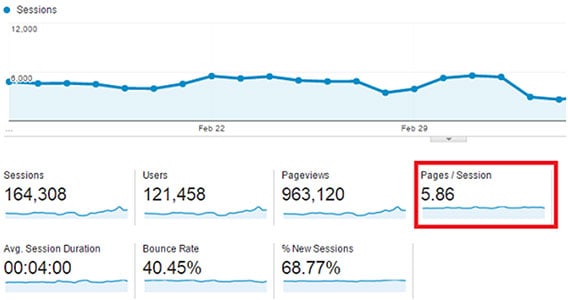
Pages per session
This is the average number of pages a user visits on your site. It’s a good indication of engagement.
Your goal number here will vary depending on your website category. For news or lifestyle websites, the higher the better, as that indicates that visitors are consuming a lot of content on the website.
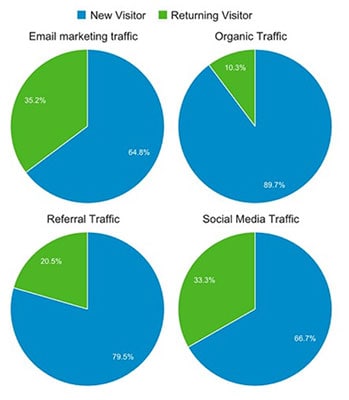
Percentage of New Users
Want to know if you’re attracting new customers? Check your New vs Returning Visitor rates. This will tell you how many of your visitors have been to your site before.
If your new visitor rate is too high, you might have a problem with retaining your current customers. On the flip side, if your returning visitor rate is too high, you probably aren’t reaching enough new potential customers.
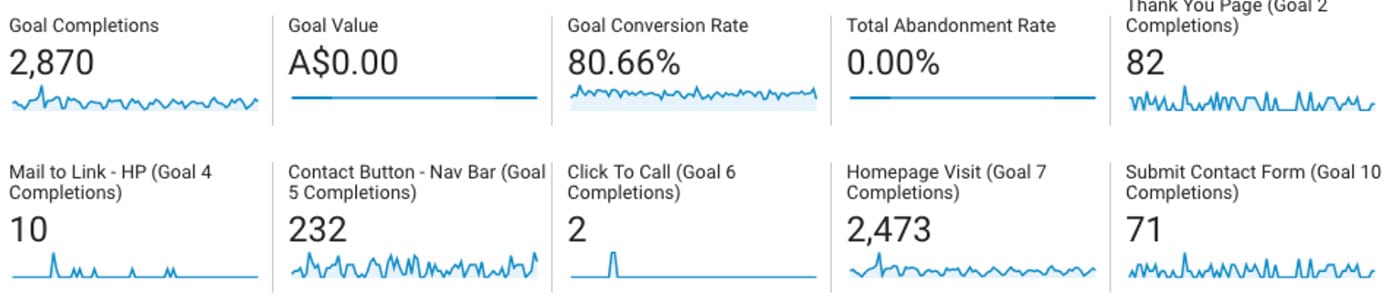
Goal Completions
Do website visitors complete the actions that you want them to?
This isn’t just making a purchase, but can also be filling out a form, clicking on your phone number or signing up to your newsletter.Set up your own unique goals to track whether your website is doing its job. For further help on how to set up goals, visit Analytics Help.
Still not a fan of Google Analytics?
While anyone can learn Google Analytics, mastering it is an art. And wanting to master it requires a certain passion for data.
At Lemon Tree, our Digital Marketing Specialist loves numbers, spreadsheets and basically anything to do with tracking and improving Google metrics. If you aren’t thrilled about data and analytics, get in touch and see how we can use data to optimise your website performance.